I have written about the concept and the tool for complexity analysis of JavaScript code before. In addition to that complexity monitoring strategy, apparently it is also useful to produce the so-called complexity report. Fortunately, now we have a visualization tool which allows us to prepare such a report.
Given a set of JavaScript files, Plato from Jarrod Overson (GitHub: github.com/jsoverson/plato) will happily consume it, run some analysis (using JSComplexity, among others), and output an interactive chart at your disposal. If you missed my previous post on code complexity, JSComplexity basically uses Esprima to parse your code, obtain the abstract syntax tree (AST), and then process it based on the complexity analysis algorithm.
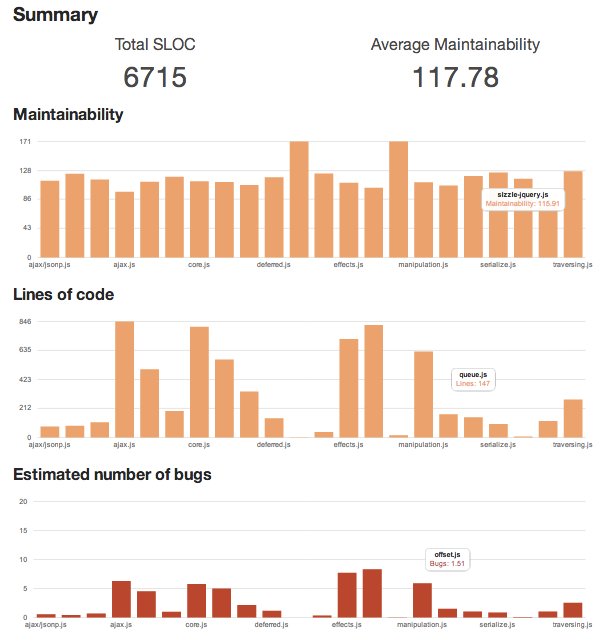
There are some ready-to-enjoy exemplary Plato reports, such as the one for jQuery. The summary page, as shown below, is useful to give a quick comparison of the different source files, in terms of code complexity, lines of code (LOC), etc.

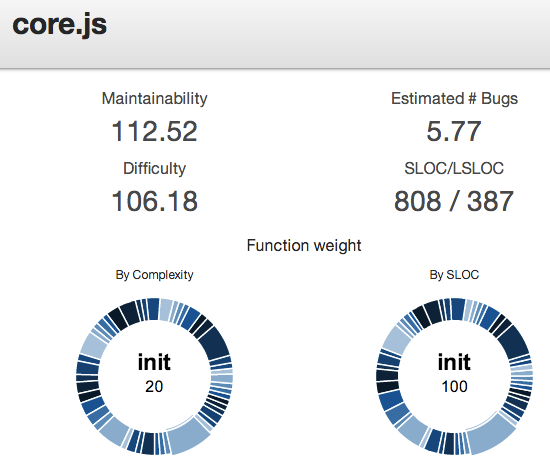
Clicking on one of the bars will open a detailed report. Particularly interesting here is the complexity distribution (depicted in a fancy donut chart) of various functions in that particular source file. Even better, when you choose a segment and click on it, it will jump to the source code directly.

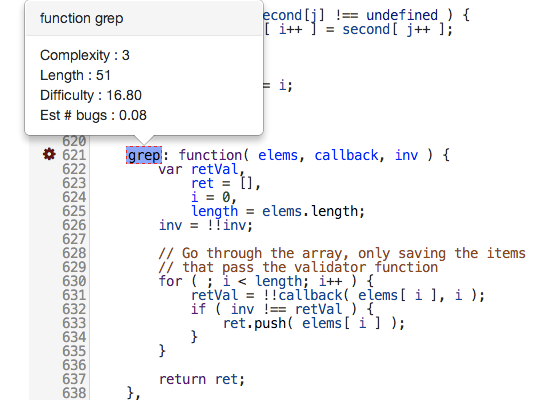
While the code view is beautiful (with syntax highlighting and such), an interesting feature here is the analysis overlay. If a function is marked with dotted border, you can hover there and there will be a nice analysis tip.

If you want try it yourself, Plato is very easy to use. Just install the plato package (you need Node.js) and you are ready to analyze your own code.
Who says code analysis can’t be fun?